
Laboratory Testing
Understanding HPLC Testing: Separation, Peaks and Peptide Analysis
Learn how HPLC separates peptide samples, how chromatograms are interpreted and why method suitability matters more than a single purity percentage.
25 October 2026 · 4 min read · Novaryn Labs
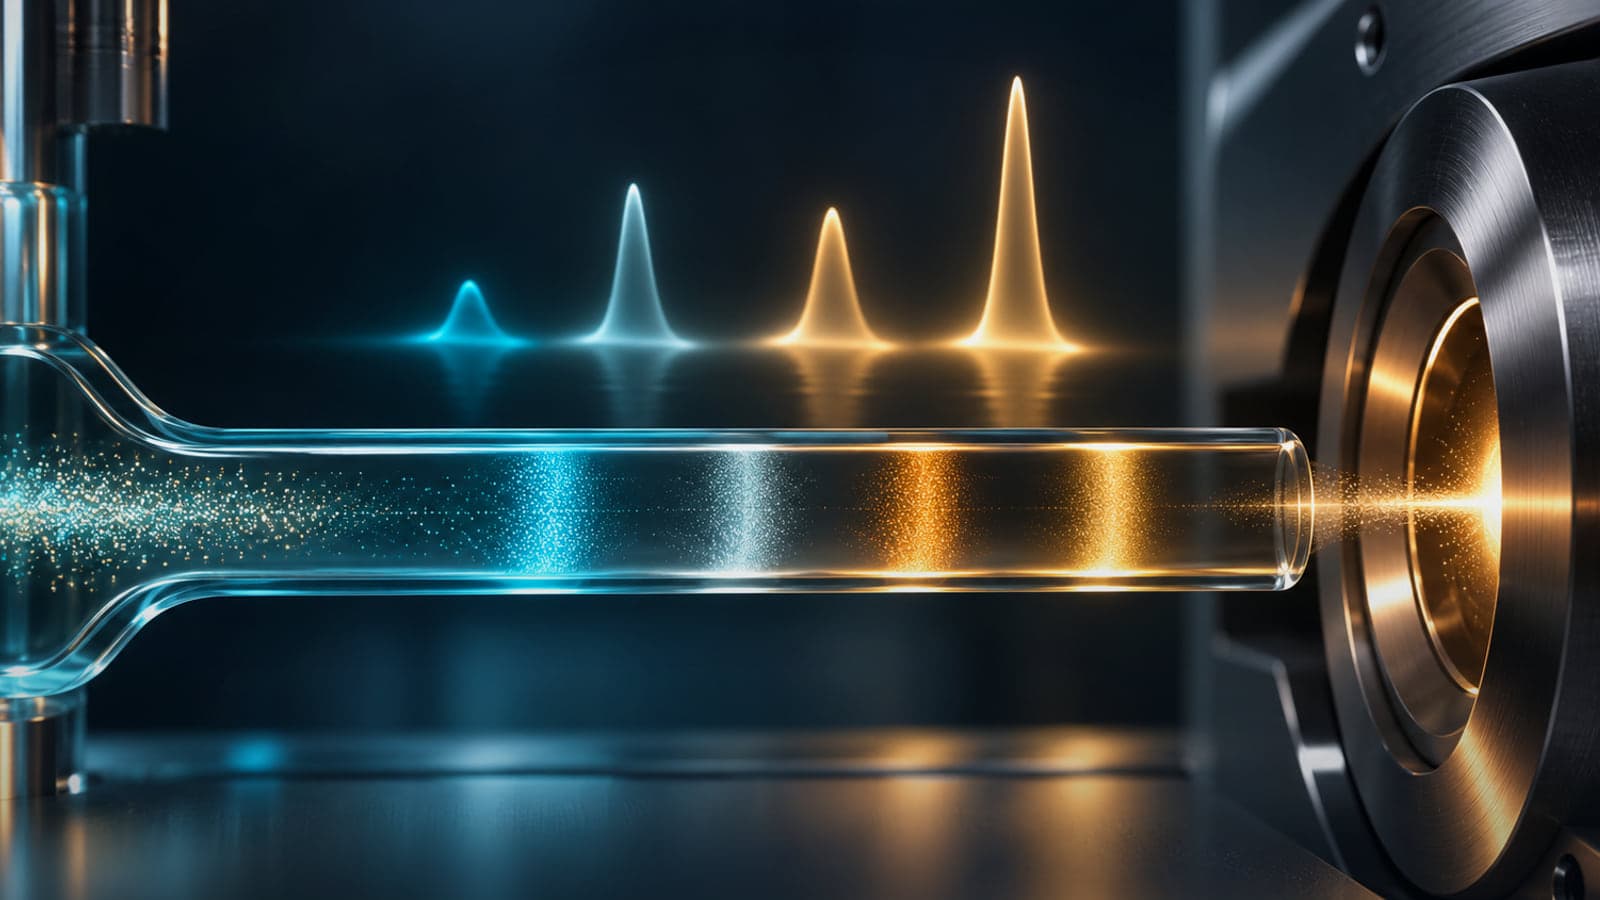
High-performance liquid chromatography, or HPLC, is a separation technique. It helps analysts examine components in a sample by moving them through a column under controlled conditions. The instrument produces a chromatogram, but the meaning of that graph depends on the method, detector and sample preparation.
For peptide research, HPLC is valuable because synthesis and storage can generate closely related components. The technique can help distinguish a principal peptide from some impurities and degradation products. It cannot identify every substance merely by drawing separate peaks.
What happens inside the system
A liquid mobile phase carries the sample through a column containing a stationary phase. Components interact differently with these two phases and therefore emerge at different times. In reversed-phase peptide analysis, differences in hydrophobic interactions are often important.
A gradient changes the mobile-phase composition during the run, allowing components with different retention behaviour to elute. Column chemistry, temperature, flow and mobile-phase composition all influence separation. Changing the method can change both the order and spacing of peaks.
Retention time is consequently a method-dependent observation. Matching a reference retention time can support an interpretation, but it is not a unique molecular fingerprint. An unrelated component may appear at a similar time, and the same peptide can appear differently under another method.
Reading the chromatogram
The horizontal axis usually represents time, while the vertical axis represents detector response. Peak height describes the maximum signal. Peak area integrates signal over time and is commonly used in quantitative analysis.
A broad peak and a narrow peak can have similar areas despite different heights. Peaks can overlap, shoulders can suggest incomplete separation, and baseline drift can complicate integration. These features are reasons to examine the method and raw data rather than relying on a cropped image of a dominant peak.
The detector also matters. Ultraviolet detection responds to substances that absorb at the selected wavelength. Different compounds may produce different signals for the same amount. Other detectors have different response properties and limitations. An area percentage is therefore inseparable from the detector conditions.
Separation quality and hidden components
Resolution describes how well neighbouring components are separated. If two substances emerge together, their signals can be combined in one apparent peak. A high main-peak percentage may then overstate the proportion of the intended compound among detected components.
Analysts can investigate this problem using alternative conditions, additional detectors or an orthogonal technique such as mass spectrometry. None of these steps should be assumed from a simple purity label. The report should make clear what was actually done.
The ICH Q2(R2) analytical validation guidance specifically discusses selectivity and the need to demonstrate suitable discrimination between relevant components. Its principles explain why a visually tidy chromatogram is not, on its own, validation of a method.
Area purity and quantitative content
Area normalisation divides the target peak area by the total area of selected integrated peaks. It is convenient for describing a chromatographic profile, but it does not automatically measure total peptide mass or account for every non-peptide constituent.
Quantitative content analysis instead relates response to a suitable reference or calibration approach. It must address whether the response is accurate and precise over the relevant range. Water, counterions and residual materials may require separate methods.
This distinction matters when comparing certificates. Two laboratories can report similar area purity values while using different wavelengths, integration thresholds or separation conditions. Without method information, small numerical differences may have little interpretable meaning.
Stability studies and forced degradation
A stability-indicating method can distinguish the target from relevant products formed as material changes. Demonstrating that capability may involve examining deliberately stressed samples and showing that degradation does not simply disappear beneath the main peak.
Forced degradation is an analytical development tool, not a prediction that every stress condition will occur during normal storage. It helps reveal weaknesses in the separation and identify useful markers. Real storage claims still require evidence under the conditions and times relevant to the material.
HPLC can also miss a biological change if that change does not alter the chosen chromatographic measurement. Where biological activity matters, chemical and functional measurements may need to be considered together.
Evaluating a report independently
Look for the sample identity, column or method reference, detector conditions, integration approach and relevant system checks. Ask whether the method is intended for identity support, impurity profiling or quantitative content. Those purposes require different demonstrations of performance.
A sensible interpretation states both the result and its scope: the sample showed a particular chromatographic profile under a specified method. Broader claims require broader evidence. That precision makes HPLC more useful, not less impressive.
Frequently asked questions
Does one peak mean one substance?
Not necessarily. Components can co-elute or be undetected under the chosen conditions.
Is retention time enough to identify a peptide?
It is supporting evidence. Structural information from another method is usually needed for stronger identification.
Why does the wavelength matter?
The detector response depends on how each component absorbs light at that wavelength.
Can HPLC measure water in the vial?
Routine peptide UV area analysis does not provide a complete water-content measurement. A suitable separate method is needed.
What is an orthogonal method?
A method based on a different measurement principle, used to test the same conclusion from another angle.
Why compare method details before purity numbers?
Because separation and detection choices can change the reported percentage without an equivalent change in the material itself.
Related reading
Scientific references
-
ICH (2024). Q2(R2) Validation of Analytical Procedures. FDA final guidance.
-
ICH Q2(R2), full guidance: specificity and analytical performance
Questions about anything in this guide?
Message the team on WhatsApp for product, batch or documentation questions. We can't give dosing or medical guidance.
For laboratory research use only. Not for human or veterinary consumption. Nothing in this article is medical advice.


